January is the month when new year resolutions are made, where we return to the gym to burn all the calories digested during the Christmas holidays… and the month when Professor Aswath Damodaran releases all of his data updates, possibly an even more important event for us finance and equity practitioners.
Prof Damodaran is one of the world’s leading corporate finance scholars. The conceptual framework he contributed to develop, in addition to the data and models he provides, are used every day by thousand of investors and corporate finance practitioners to perform business equity valuations.
Let us have a closer look at the January 2019 data update, alongside some core findings and observations.
Equity Risk Premium
The ERP is one of the building blocks of the cost of equity as per the CAPM. It broadly represents the extra return that an investor requires to take on the added risk of investing in equity rather than in bonds. Given the abundance of data available and the market liquidity, the Equity Risk Premium is always calculated for a mature market, like the US.
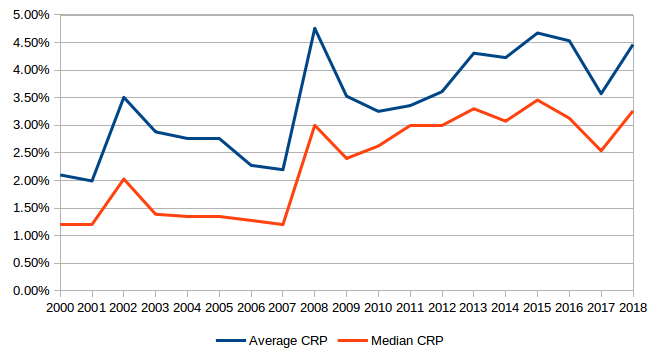
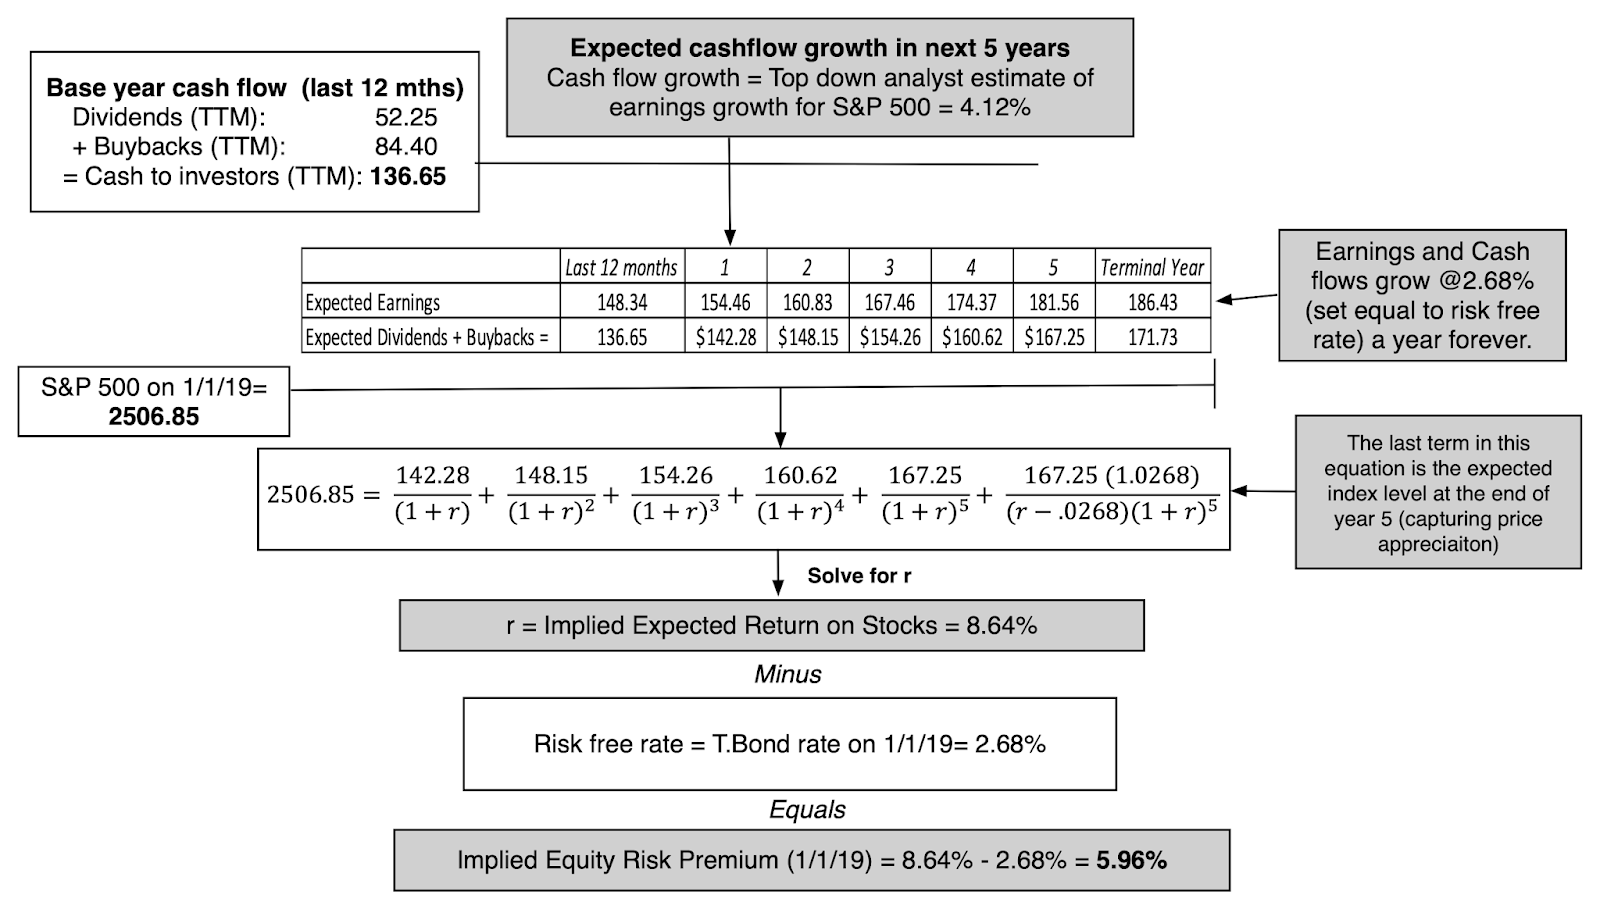
Damodaran approximates the ERP as the internal rate of return embedded in the current level of the S&P 500 and the market expectations for the S&P 500 future cashflows in forms of dividends and share buybacks, analogous to the yield to maturity on a bond.
Some observations on the January 2019 ERP update:
- In January 2019, the ERP is calculated to be 5.96%, compared to 5.08% in January 2018.
- A number of practitioners prefer using the point-in-time estimate as an input in the ERP, and therefore should now use 5.96% instead of 5.08% and increase their cost of equity by 0.88%. Some others would prefer to use a long-term average of the ERPs to reflect the long-term nature of the equity holding periods, in that case they should use a number like 5.5%, which is the last 10 years’ simple average of ERPs.
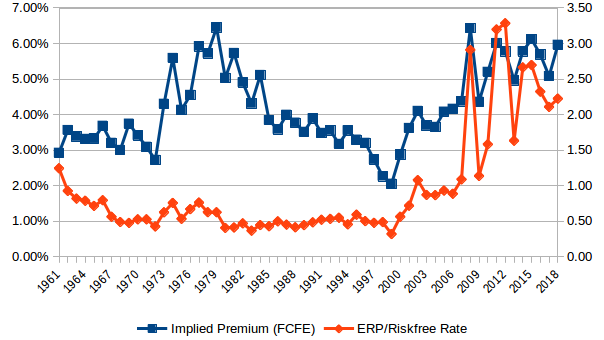
- It is also interesting to compare the latest estimate with historical ones, plotted in the chart below. This year’s implied ERP (blue line) is in the top decile of recorded history. The ERP to risk free rate ratio is also at historical post-crisis highs and slightly higher than last year. This means that the compensation that an investor requires to hold stocks continues to be high, as well as the premium to risk free rate.
Risk Free Rates and Bond Premia
The second data dump is related to the bond markets, where Prof Damodaran is – by his own admission – less of an expert.
Regardless, he provides a couple of useful data points:
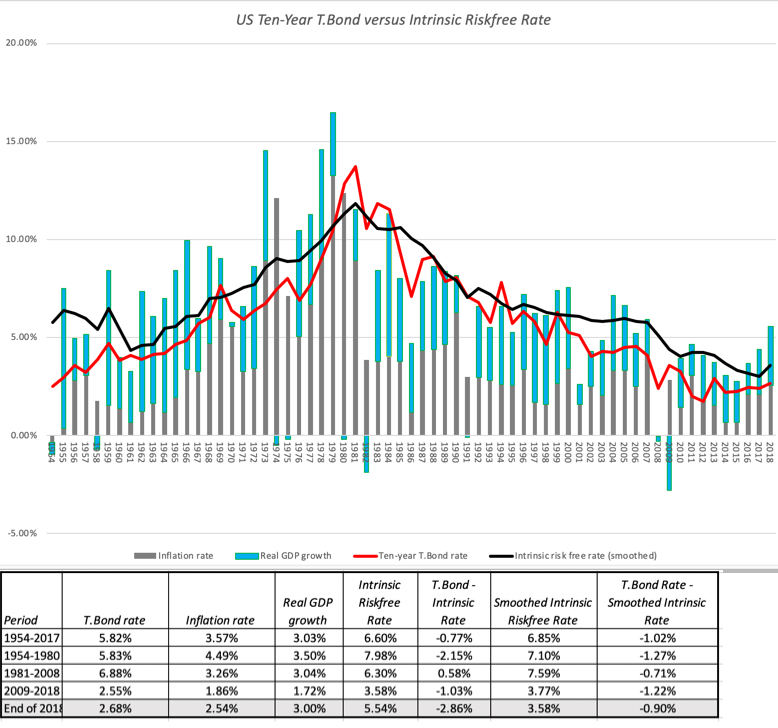
- The 10 year T-bill rate was 2.68%, however the intrinsic smoothed risk-free rate was 3.58% (calculated as the sum of inflation and real GDP growth). Despite the sharp increase of the Fed funds rate at the short-term end of the spectrum, Damodaran believes that the FED has only a limited power to influence long-term rates. These are instead a product of investors’ expectations on long-term growth and inflation. The fact that they have remained low possibly suggests that investors have still downbeat expectations on future growth.
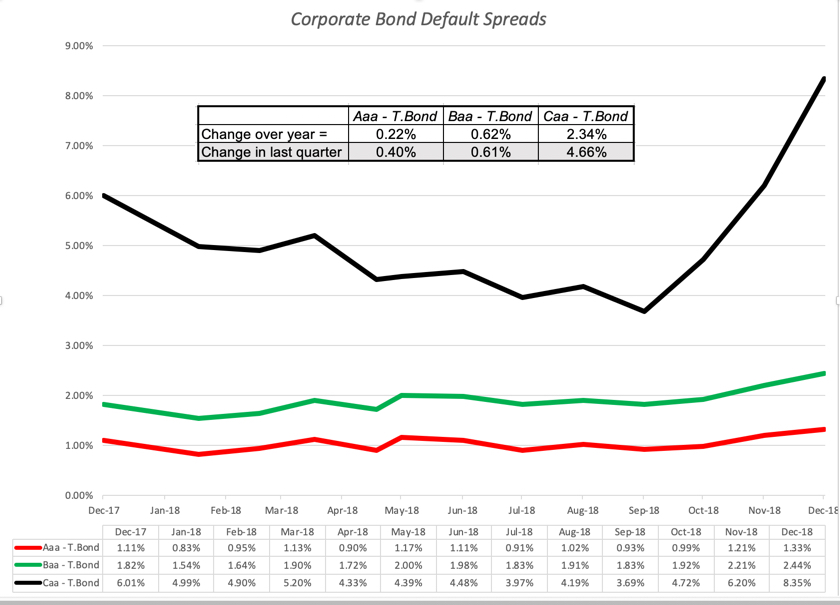
- The corporate default spreads have widened, reflecting higher risk pricing particularly for lower rated paper.
Country Risk Premia
A third and very important data update is about the country risk premia.
These are very important for those (like myself) that are interested in investing in emerging markets and – more broadly – non-US companies.
Damodaran broadly defines the country risk premium as an additional compensation that an investor would require to invest in a non-mature equity market, relative to the US. The compensation is driven among others by increased sovereign credit risk, higher illiquidity of the non-US exchanges, higher volatility of non-US stock markets.
The way Damodaran approximates the country risk premium is two-fold:
- The first method focuses on sovereign market CDS (Credit Default Swaps) spreads, and their excess to the US CDS spread.
- The second method looks at the sovereign credit rating attributed by Moody’s & S&P’s. The rating class is then translated in a basis-point excess spread vis-a-vis the US.
The rating spread and the CDS excess spreads are also scaled with a multiplier that reflects the excess relative volatility between bonds and equities in non-mature markets. In reality, the Damodaran table applies the multiplier also to developed markets (need to switch off the toggle otherwise). The multiplier in January 2019 is 1.23.
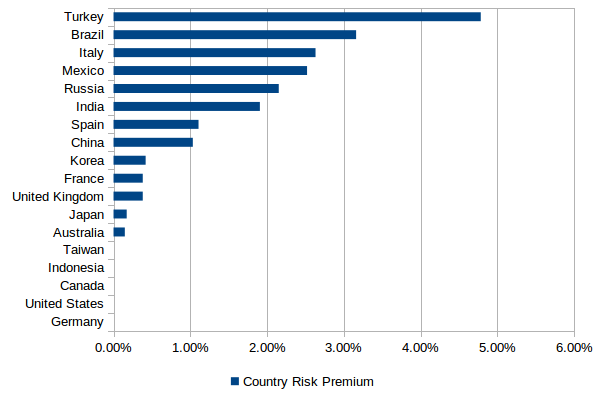
Below is a chart with the country risk premium for the 20 largest world economies as of January 2019.
I took the freedom to check how the January 2019 calculated country risk premia compare with historical levels. See chart below.
The post-2008 general increase can mean that more countries where added to the sample, as generally more data became available. However, the 2018 increase with the current release means that – on average – there is higher demand for compensation this year for investing in non-US equities that there was last year, on average. In other words, the world may have become (or is perceived to be) a more dangerous place.